CDC
-----
In databases, change data capture (CDC) is a set of software design patterns used to determine (and track) the data that has changed so that action can be taken using the changed data. Also, Change data capture (CDC) is an approach to data integration that is based on the identification, capture and delivery of the changes made to enterprise data sources.
CDC solutions occur most often in data-warehouse environments since capturing and preserving the state of data across time is one of the core functions of a data warehouse, but CDC can be utilized in any database or data repository system.
---wikipedia
If you are not familiar with CDC, here a brief summary: CDC allows you to capture all the data from the source system that has changed since the last time you ran the ETL process. Wikipedia gives a more detailed overview in case you are interested. In the easiest case you have some sort of timestamp or datetime column that you can use for this purpose. The following example will be based on a simple sales table that has a date column which we can use for CDC:

Note that this is dataset has actually quite old data, something that we have to keep in mind. What happens if new data gets inserted later on? More on this after the basics.
Open your favourite SQL Client (and start your MySQL server if it is not running yet) and issue following SQL statements:
USE
test
;
DROP TABLE IF EXISTS
`sales`
;
CREATE TABLE
`sales`
(
`date` DATETIME,
`product_type` VARCHAR(45),
`sales` INT(255)
)
;
INSERT INTO
`sales`
VALUES
('2010-01-20 00:00:00','Shoes',234),
('2010-01-20 00:00:00','Cheese',456),
('2010-01-21 00:00:00','Shoes',256),
('2010-01-21 00:00:00','Cheese',156),
('2010-01-22 00:00:00','Shoes',535),
('2010-01-23 00:00:00','Cheese',433)
;
SELECT
*
FROM
`sales`
;
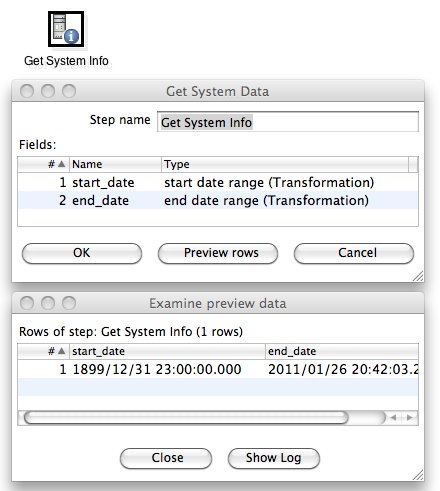
Now the way to get the timeframes for querying the data is to use the Get System Info step:
- Open Kettle and create a new transformation
- Drag and drop a Get System Info step on the canvas. You can find it in the Input folder.
- Double click on it and populate the names column in the grid with start_date and end_date.
- For the type choose start date range (Transformation) and end date range (Transformation) respectively
Click on Preview rows and you will see that Kettle displays a rather old datetime for the startdate (1899/12/31 23:00:00) and the current datetime for the enddate. Now this makes perfectly sense as with first run of your transfromation you want to get all the raw data from your source system. In case you don’t want this, I’ll show you a trick later on on how to change this.
Now this is an easy approach for CDC. You can feed the start and end date from the Get System Info step to a Table Input step in example and use the start and end date in the WHERE clause of your SQL query:
SELECT
date
, product_type
, sales
FROM sales
WHERE
date>=? AND
date<?
;
The question marks will be replaced on execution by the start and end date (but make sure they are defined in this order in the Get System Info step).
Let's add some more steps to our transformation:
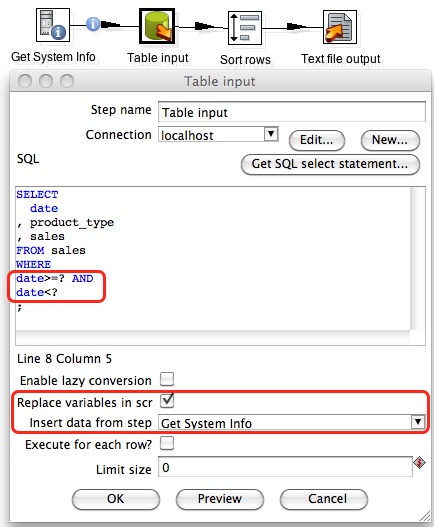
Make sure that you enable Replace variables in script? and choose the Get System Info step for Insert data from step. The hop between the Get System Info step and the Table Input step now also displays an info icon.
Setting up Logging
Kettle provides various levels of logging, the transformation logging being the one with the highest level. We will only look at the transformation logging here.
- Press CTRL+T and the Transformation properties dialog will be displayed.
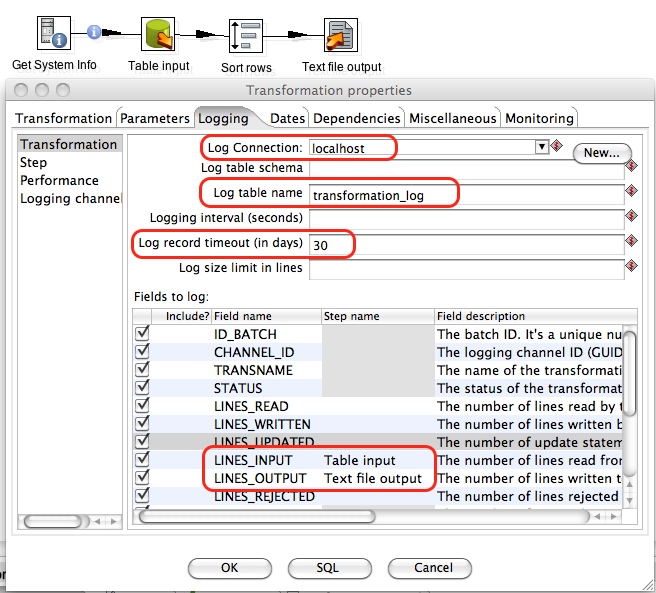
- Click on the Logging tab and then highlight Transformation on the left hand side.
- Our log will be placed in a database table, hence provide the info for the data connection and table name.
- We only want to keep the log records for the last 30 days, hence we set Log record timeout (in days) to 30.
- It’s best to keep all the logging fields (less maintenance)
- Provide step names for some of the fields, in example:
- LINES_INPUT: specify the input step that represents the amount of imported data best.
- LINES_OUTPUT: specify the output step that represents the amount of imported data best
- Press the SQL button and Kettle will automatically generate the DDL (the create table statement) for you. Just press Execute and your logging table will be created on your specified database. Nice and easy!
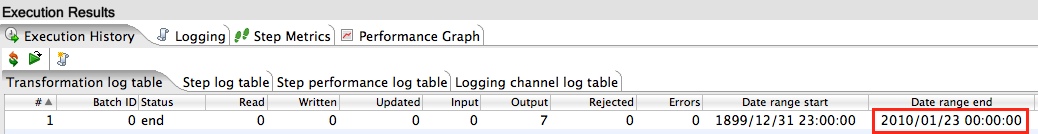
So now we are all set and can run our transformation and see what’s happening. Click the Play button to execute the transformation. If your transformation executed successfully, close the transformation and open it again, then on the bottom click on the Execution History tab and you will so the logging information. (Kettle automatically reads the data from the table we just created).
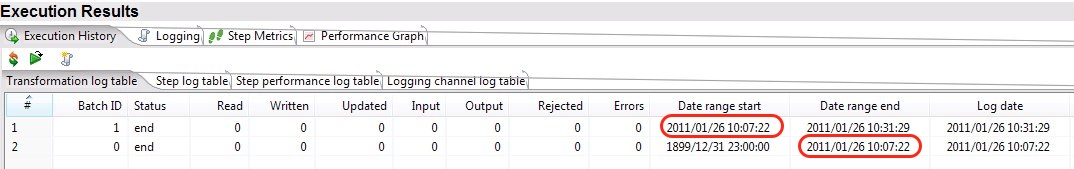
Now pay attention to the Date Range Start and Date Range End field: It includes the data from our Get System Info step. Now execute the transformation again and see what happens (Click the Refresh button):
- You can clearly see that Kettle new choose the CDC end datetime (which is the start datetime) of the last transformation execution for the start date. The last transformation execution has the Batch ID 0 in the screenshot above.
- The CDC end date is set to the start date of the current transformation execution.
A safe approach to CDC
The CDC approach mentioned above is actually quite dangerous if your source data table doesn't get filled consistently. A safer approach is to use the maximum date of your source data as the CDC end date. Kettle provides this functionality out of the box: In the Transformation properties you can find a Dates tab. Click on it and provide following details of your fact table:
- Maxdate Connection: the database connection
- Maxdate table: the table name of your source table
- Maxdate field: the datetime field in your source table that you use for CDC
- Maxdate offset (seconds): If there are some inconsistencies in your source data, you can set a negative offset here. In example: -120 means that 120 seconds will be deducted from the max end date for CDC
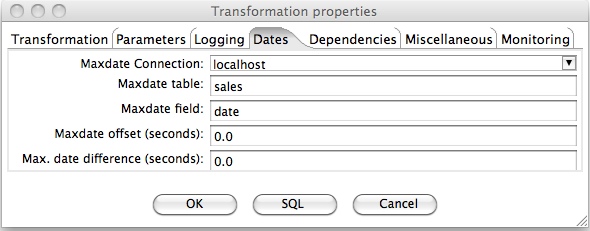
As you can see from the screenshot above, I referenced again our main input table. So whatever the maximum date in this table is, Kettle will now use it for CDC. Open MySQL Client and delete all the records from our transformation log table, then start the transformation. As you can see from the Execution History Kettle now use the maximum date of our data set.
What more to say? Well, if you are unhappy with the first timeframe that Kettle chooses, just run the transformation once without any raw data input step, open a SQL client and update the end date with a date of your liking (this end date should be the start date that you want for the next execution). The next time you run your transformation, this datetime will be used for the start of your timeframe.
References
http://diethardsteiner.blogspot.in/


